

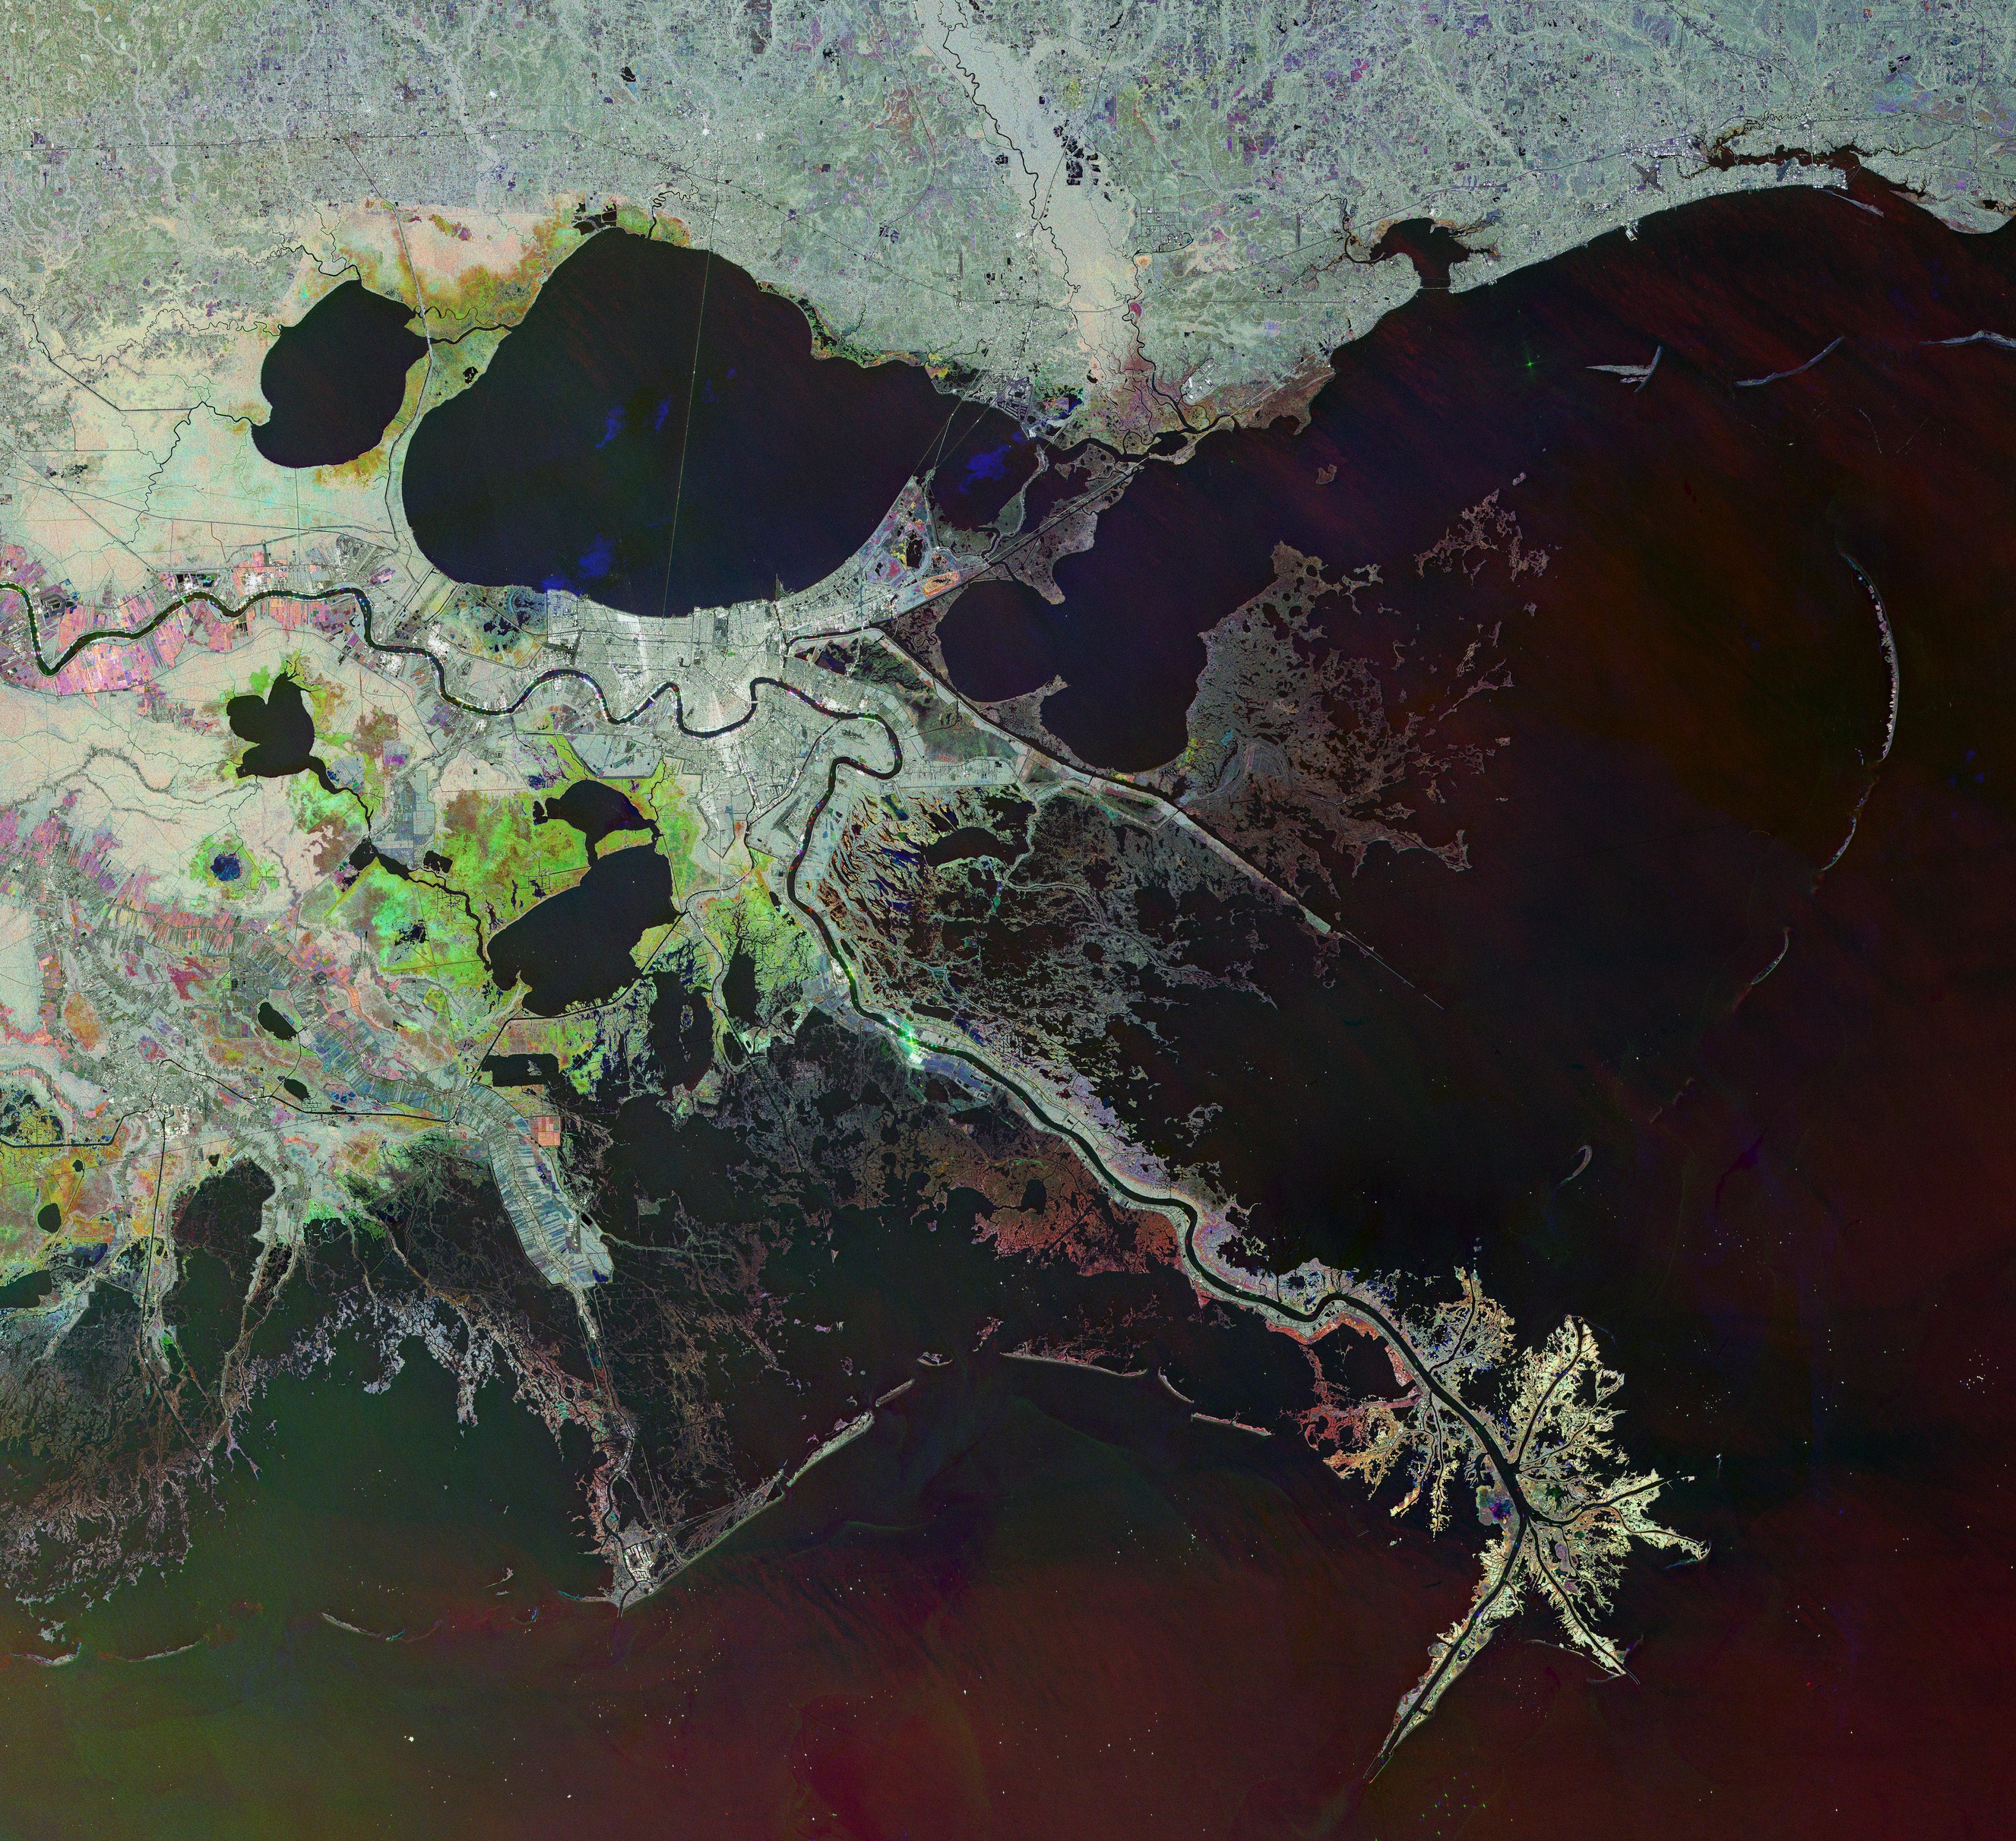
Questa colorata immagine radar, catturata dalla missione Copernicus Sentinel-1, mostra New Orleans ed il delta del fiume Mississippi, uno dei fiumi più grandi del Nord America.
Il fiume Mississippi è uno dei principali sistemi fluviali al mondo per dimensioni, diversità di habitat e produttività biologica. È un classico esempio di fiume sinuoso alluvionale, con i suoi anelli e curve lungo il suo percorso. Il suolo ricco di nutrienti, provenienti dai depositi sedimentari trasportati nella pianura alluvionale dal Mississippi e dai suoi affluenti, sostiene una varietà di terreni coltivati.
L'area qui raffigurata mostra l'ultimo tratto del suo percorso lungo in totale 3766 km, dove il Mississippi attraversa la città di New Orleans e sfocia nel Golfo del Messico in un vasto delta, noto come delta ‘zampa di uccello’ ('bird-foot' – NdT) per la forma creata dai canali che si estendono verso l'esterno. La dimensione del delta è dovuta alla deposizione di sedimenti nell'arco di milioni di anni. Le tonnellate di sedimenti trasportati dal sistema fluviale hanno creato le zone umide del sud della Louisiana, che ospitano molte specie in pericolo di estinzione.
Questa immagine combina tre acquisizioni radar da Sentinel-1 ottenute a due mesi di distanza tra febbraio e giugno 2026, con ciascuna immagine assegnata ad un colore diverso – rosso per febbraio, verde per aprile e blu per giugno. Quando si sovrappongono i colori vivaci risultanti indicano cambiamenti sul terreno che si sono verificati nel tempo.
I corpi d'acqua, inclusi anche il serpeggiare del Mississippi ed i laghi interni, appaiono per lo più neri poiché le superfici dell'acqua lisce riflettono il segnale radar lontano dal satellite. Nel Golfo del Messico, al contrario, la miscela di colori indica modificazioni superficiali, causati tra ogni acquisizione dal vento o dalle correnti.
Se osserviamo più da vicino possiamo vedere navi nel golfo e sul Mississippi come puntini scintillanti e multicolori, con il colore relativo alla data di acquisizione: le navi catturate a febbraio appaiono in rosso, quelle di aprile in verde e quelle di giugno in blu.
Le sfumature di grigio indicano aree senza o con pochissimi cambiamenti, come la conurbazione di New Orleans, che appare di un grigio brillante o bianco lungo la riva meridionale del Lago Pontchartrain, il più grande lago interno compreso nell'immagine. Diversi ponti che attraversano il lago appaiono visibili come linee sottili e rettilinee, in particolare il Pontchartrain Causeway proprio al centro, ritenuto il ponte continuo sull'acqua più lungo del mondo.
Macchie di verde neon, rosa e rossastre si possono osservare ad ovest ed a sud di New Orleans, segnando le aree dove il paesaggio cambia notevolmente tra inverno ed estate. Le zone verdi indicano la vegetazione che ha germogliato, che è cresciuta più densa oppure che ha registrato livelli di umidità più elevati in aprile, mentre tonalità rosa e rossastra evidenziano le aree dove le condizioni del terreno o la crescita della vegetazione sono state più forti durante il mese di febbraio.
Queste immagini radar sono preziose per l'agricoltura ed il controllo ambientale, permettendo agli scienziati di monitorare la crescita stagionale delle colture, l'umidità del suolo e la salute delle zone umide. Queste ultime informazioni sono estremamente importanti, soprattutto nelle zone costiere basse come New Orleans, in quanto aiutano anche a proteggere la terraferma dalle minacce meteorologiche estreme.
Scarica immagine Hi-Res (9,94 MB - .JPG)
Scarica immagine Hi-Res (1,13 GB - .TIF)
---
New Orleans and the mighty Mississippi
This colourful radar image captured by the Copernicus Sentinel-1 mission features New Orleans and the delta of the Mississippi River, one the largest rivers in North America.
The Mississippi River is one of the world’s major river systems in size, habitat diversity and biological productivity. It is a classic example of a meandering alluvial river with its loops and curls along its path. The nutrient-rich soil from sediment deposits carried by the Mississippi and its tributaries in the floodplain supports a variety of cropland.
The area pictured here shows the last segment of its 3766-km-long path, where the Mississippi passes through the city of New Orleans and empties into the Gulf of Mexico in a vast delta, known as the 'bird-foot' delta because of the shape created by the channels extending outward. The size of the delta is due to sediment deposition over millions of years. The tons of sediment carried by the river system created the wetlands in southern Louisiana, which are home to many endangered species.
This image combines three radar acquisitions from Sentinel-1 taken two months apart from February to June 2026, with each image assigned to a different colour channel – red for February, green for April and blue for June. When overlapped, the bright resulting colours indicate changes on the ground that have occurred over time.
Water bodies, including the snaking Mississippi and the inland lakes, appear mostly black as smooth water surfaces reflect the radar signal away from the satellite. In the Gulf of Mexico, on the other hand, the mix of colours denotes changes on the surface, caused by wind or currents between each acquisition.
If we take a closer look, we can see ships in the gulf and on the Mississippi, as sparkling, multi-coloured dots, with the colour corresponding to the date of acquisition. Ships captured in February appear in red, those from April in green, and those from June in blue.
Shades of grey indicate areas with no or very little changes, such as the conurbation of New Orleans, which appears bright grey or white along the southern shore of Lake Pontchartrain, the largest inland lake in the image. Visible as thin, straight lines, several bridges cross the lake, notably the Pontchartrain Causeway right at the centre, which is recognised as the world’s longest continuous bridge over water.
Patches of neon green, pink and reddish colours can be seen to the west and south of New Orleans, marking the areas where the landscape changed considerably between winter and summer. Green zones indicate vegetation that sprouted, grew densest or experienced higher moisture levels in April, while pink and reddish tones highlight regions where ground conditions or vegetation growth were strongest during February.
Such radar images are invaluable for agriculture and environmental monitoring, allowing scientists to track seasonal crop growth, soil moisture, and the health of wetlands. The latter are extremely important, particularly in low-lying coastal areas such as New Orleans, as they also help protect the mainland from severe weather threats.
[Credits: contains modified Copernicus Sentinel data (2026), processed by ESA - Translation: Gianluca Pititto]



